Hamilton District Council election
1992 Hamilton District Council election | ← 1988 | 7 May 1992 (1992-05-07) | |
|
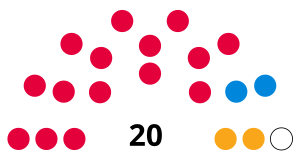
All 20 seats to Hamilton District Council
11 seats needed for a majority |
|---|
| Registered | 79,751 |
|---|
| Turnout | 36.9% |
|---|
| |
 The result of the election |
Council Leader before election
Labour
| Council Leader after election
Labour
| |
Elections to Hamilton District Council were held on 7 May 1992, on the same day as the other Scottish local government elections. This was the final election to the district council which was abolished in 1995 along with East Kilbride District Council and Clydesdale District Council and, combined with part of the abolished City of Glasgow District Council, was replaced by South Lanarkshire Council following the implementation of the Local Government etc. (Scotland) Act 1994. The regional council, Strathclyde, was also abolished and the new unitary authority took on its responsibilities.
The election was also the last to use the 20 wards created by the Initial Statutory Reviews of Electoral Arrangements in 1980 without alterations. Each ward elected one councillor using first-past-the-post voting.[1]
Labour maintained control of the district council after winning 15 of the 20 seats. Despite a slight reduction in their vote share, they again took more than have the votes cast. Both the Conservatives and Liberal Democrats won two seats and the remaining seat was won by Independent Labour. Despite coming second in the popular vote, the Scottish National Party (SNP) lost their only seat.
Results
Hamilton District Council election result 1992 | Party | Seats | Gains | Losses | Net gain/loss | Seats % | Votes % | Votes | +/− |
| | Labour | 15 | 2 | 2 |  | 75.0 | 52.2 | 15,271 |  2.5 2.5 |
| | Conservative | 2 | 1 | 0 |  1 1 | 10.0 | 11.5 | 3,340 | 1.5 |
| | Liberal Democrats | 2 | 0 | 0 | | 10.0 | 7.3 | 2,121 | 0.5 |
| | Independent Labour | 1 | 1 | 1 | | 5.0 | 5.5 | 1,634 | 1.1 |
| | SNP | 0 | 0 | 1 | 1 | 0.0 | 22.8 | 6,651 | 2.9 |
| | Independent | 0 | 0 | 0 | | 0.0 | 0.5 | 199 | New |
| | Scottish Green | 0 | 0 | 0 | | 0.0 | 0.4 | 99 | New |
| | Democratic Left | 0 | 0 | 0 | | 0.0 | 0.1 | 57 | New |
| Total | 20 | | | | | | 29,282 | |
Source:[2][3]
Ward results
Hillhouse
Hillhouse | Party | Candidate | Votes | % | ±% |
| | Labour | R. Newberry | 562 | 67.8 | 10.7 |
| | SNP | T. Muir | 264 | 31.8 | 13.7 |
| Majority | 298 | 36.0 | 24.4 |
| Turnout | 826 | 24.7 | 18.7 |
| Registered electors | 3,353 | | |
| | Labour hold | Swing | 12.2 | |
Source:[2][3]
Udston
Udston | Party | Candidate | Votes | % | ±% |
| | Labour | J. Daisley | 1,109 | 73.6 | 0.6 |
| | SNP | V. Dow | 288 | 19.1 | 6.3 |
| | Scottish Green | J. Condron | 99 | 6.6 | New |
| Majority | 821 | 54.5 | 5.7 |
| Turnout | 1,496 | 36.8 | 12.6 |
| Registered electors | 4,094 | | |
| | Labour hold | Swing | 0.3 | |
Source:[2][3]
Wellhall North
Source:[2][3]
Central
Source:[2][3]
Burnbank
Source:[2][3]
Ferniegair
Source:[2][3]
Fairhill
Fairhill | Party | Candidate | Votes | % | ±% |
| | Labour | J. Walls | 548 | 36.4 | 28.4 |
| | Independent Labour | N. Cochrane | 495 | 32.8 | New |
| | SNP | S. McCandless | 344 | 22.8 | 9.0 |
| | Independent | J. Williamson | 119 | 7.9 | New |
| Majority | 53 | 3.6 | 27.4 |
| Turnout | 1,506 | 41.7 | 6.8 |
| Registered electors | 3,618 | | |
| | Labour hold | Swing | 30.6 | |
Source:[2][3]
Woodhead
Source:[2][3]
Low Waters
Source:[2][3]
Cadzow
Cadzow | Party | Candidate | Votes | % | ±% |
| | Labour | R. McKeown | 919 | 51.0 | 5.2 |
| | SNP | J. Smith | 876 | 48.6 | 0.9 |
| Majority | 43 | 2.4 | N/A |
| Turnout | 1,795 | 44.5 | 6.9 |
| Registered electors | 4,055 | | |
| | Labour gain from SNP | Swing | 2.1 | |
Source:[2][3]
Dalserf
Dalserf | Party | Candidate | Votes | % | ±% |
| | Labour | M. Ahmed | 814 | 67.7 | 15.6 |
| | SNP | I. McGowan | 367 | 30.5 | 16.1 |
| Majority | 447 | 37.2 | 5.9 |
| Turnout | 1,181 | 35.7 | 17.0 |
| Registered electors | 3,370 | | |
| | Labour hold | Swing | 8.2 | |
Source:[2][3]
Larkhall East
Larkhall East | Party | Candidate | Votes | % | ±% |
| | Labour | R. Ferguson | 651 | 53.7 | 4.6 |
| | SNP | M. Miller | 551 | 45.5 | 4.4 |
| Majority | 100 | 8.2 | 9.0 |
| Turnout | 1,202 | 35.0 | 11.6 |
| Registered electors | 3,466 | | |
| | Labour hold | Swing | 4.5 | |
Source:[2][3]
Larkhall North
Larkhall North | Party | Candidate | Votes | % | ±% |
| | Labour | R. Ferguson | 819 | 63.4 | 2.8 |
| | SNP | J. Meikle | 459 | 35.5 | 2.7 |
| Majority | 360 | 27.9 | 5.5 |
| Turnout | 1,278 | 33.1 | 13.1 |
| Registered electors | 3,904 | | |
| | Labour hold | Swing | 2.7 | |
Source:[2][3]
Larkhall South
Larkhall South | Party | Candidate | Votes | % | ±% |
| | Labour | S. Casserly | 776 | 67.8 | 4.8 |
| | SNP | S. Clarkson | 362 | 31.6 | 4.3 |
| Majority | 414 | 36.2 | 9.1 |
| Turnout | 1,138 | 35.5 | 15.2 |
| Registered electors | 3,225 | | |
| | Labour hold | Swing | 4.5 | |
Source:[2][3]
Stonehouse
Stonehouse | Party | Candidate | Votes | % | ±% |
| | Labour | R. Gibb | 1,120 | 68.6 | 2.6 |
| | SNP | G. Sutherland | 502 | 30.7 | 17.3 |
| Majority | 618 | 37.9 | 8.7 |
| Turnout | 1,622 | 39.4 | 10.6 |
| Registered electors | 4,140 | | |
| | Labour hold | Swing | 1.9 | |
Source:[2][3]
Uddingston
Source:[2][3]
Bothwell
Bothwell | Party | Candidate | Votes | % | ±% |
| | Labour | M. Rooney | 920 | 50.7 | 9.5 |
| | Conservative | I. S. MacAusline | 885 | 48.8 | 33.5 |
| Majority | 35 | 1.9 | 5.3 |
| Turnout | 1,805 | 37.8 | 18.7 |
| Registered electors | 4,794 | | |
| | Labour hold | Swing | 4.8 | |
Source:[2][3]
High Blantyre
Source:[2][3]
Blantyre
Source:[2][3]
Stonefield
Stonefield | Party | Candidate | Votes | % | ±% |
| | Labour | M. McGlynn | 1,025 | 69.6 | 7.4 |
| | SNP | P. Stewart | 442 | 30.0 | 7.3 |
| Majority | 583 | 39.6 | 14.7 |
| Turnout | 1,467 | 34.4 | 11.2 |
| Registered electors | 4,282 | | |
| | Labour hold | Swing | 7.3 | |
Source:[2][3]
References
- ^ "Initial Statutory Reviews of Electoral Arrangements". Local Government Boundary Commission for Scotland. Retrieved 26 December 2023.
- ^ a b c d e f g h i j k l m n o p q r s t u Botchel, J. M.; Denver, D. T. (1992). The Scottish Council Elections 1992: Results and Statistics (PDF). Dundee: Election Studies, University of Dundee. ISBN 1-869820-04-5. Retrieved 27 December 2023.
- ^ a b c d e f g h i j k l m n o p q r s t u Botchel, J. M.; Denver, D. T. (1989). The Scottish District Elections 1988: Results and Statistics (PDF). Dundee: Election Studies, University of Dundee. ISBN 1-869820-02-9. Retrieved 29 December 2023.


 2.5
2.5  1
1 


