2012 UK local government election
2012 Derby City Council election[1] [2] First party Second party Third party Party Labour Conservative Liberal Democrats Seats before 22 16 12 Seats won 10 4 3 Seats after 28 14 9 Seat change Popular vote 24,982 13,671 11,529 Percentage 44.7% 24.5% 20.6%
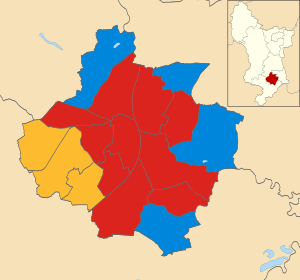
Map showing the results of contested wards in the 2012 Derby City Council elections
Council control before election No overall control
Council control after election Labour
The 2012 Derby City Council election took place on 3 May 2012 to elect members of Derby City Council in England. The Labour Party gained control of the council, which had previously been under No Overall Control.
Election results 2012 Derby City Council election Party Seats Gains Losses Net gain/loss Seats % Votes % Votes +/− Labour 10 6 0 6 58.8 44.7 24,982 16.6 Conservative 4 1 2 1 23.5 24.5 13,671 10.7 Liberal Democrats 3 0 5 5 17.6 20.6 11,529 11.7 UKIP 0 0 0 0.0 5.4 3,033 New Green 0 0 0 0.0 3.0 1,667 2.5 BNP 0 0 0 0.0 1.8 1,031 0.2
All comparisons in vote share are to the corresponding 2008 election .
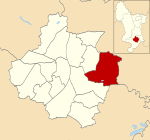
Ward results Abbey Location of Abbey ward Abbey (1 seat) Party Candidate Votes % Labour Sarah Elizabeth Russell 1,330 46.3 Liberal Democrats Rehmat Khan 1,026 35.7 Conservative John Cope 284 9.9 Green Tom Reading 233 8.1 Turnout Labour gain from Liberal Democrats
Allestree Location of Allestree ward Allestree (1 seat) Party Candidate Votes % Conservative Philip Hickson 2,040 47.2 Labour Helen McCartney Butcher 1,289 29.8 UKIP Martin Du Sautoy 647 15.0 Liberal Democrats Peter Barker 179 4.1 Green Jane Sarah Temple 172 4.0 Turnout Conservative hold
Alvaston Location of Alvaston ward Alvaston (1 seat) Party Candidate Votes % Labour Mark Stuart Tittley 1,471 48.0 UKIP Alan Wayne Graves 1,007 32.8 Conservative Alan Leslie Grimadell 471 15.4 Liberal Democrats John Edward Ahern 119 3.9 Turnout Labour hold
Arboretum Location of Arboretum ward Arboretum (1 seat) Party Candidate Votes % Labour Gulfraz Nawaz 1,757 44.7 Liberal Democrats Tullah Khan 1,743 44.3 Green Simon Hales 248 6.3 Conservative Ross McCristal 186 4.7 Turnout Labour gain from Liberal Democrats
Blagreaves Location of Blagreaves ward Blagreaves (1 seat) Party Candidate Votes % Liberal Democrats Joe Singh Naitta 1,741 46.4 Labour Michelle Joanne McFarlane 1,569 41.8 Conservative Edward Montgomery Ashford 442 11.8 Turnout Liberal Democrats hold
Boulton Location of Boulton ward Boulton (1 seat) Party Candidate Votes % Labour Alison Martin 1,720 56.6 Conservative Frank Leeming 678 22.3 UKIP Steve Fowke 445 14.6 Green David Foster 123 4.0 Liberal Democrats Kyle Martin 75 2.5 Turnout Labour gain from Conservative
Chaddesden Location of Chaddesten ward Chaddesden (1 seat) Party Candidate Votes % Labour Anne MacDonald 1,689 54.2 Conservative Steve Hassall 836 26.8 BNP Paul Hilliard 459 14.7 Liberal Democrats Ian Colin Deuchar Care 134 4.3 Turnout Labour gain from Conservative
Chellaston Location of Chellaston ward Chellaston (1 seat) Party Candidate Votes % Conservative Matthew Edward Holmes 1,430 42.2 Labour Paul Thomas Hezelgrave 1,394 41.2 UKIP Paul Andrew Randle 458 13.5 Liberal Democrats Nazir Hussain 105 3.1 Turnout Conservative hold
Darley Location of Darley ward Darley (1 seat) Party Candidate Votes % Labour Jack Stanton 1,403 41.4 Conservative John David Howard 841 24.8 Liberal Democrats Finbar Richards 564 16.6 Green David Clasby 375 11.1 UKIP Ian Edward Crompton 205 6.0 Turnout Labour gain from Liberal Democrats
Derwent Location of Derwent ward Derwent (1 seat) Party Candidate Votes % Labour Margaret Eileen Redfern 1,314 51.6 Liberal Democrats Richard Hudson 689 27.1 BNP Julie Fuller 302 11.9 Conservative Nicola Angela Roulstone 239 9.4 Turnout Labour hold
Littleover Location of Littleover ward Littleover (1 seat) Party Candidate Votes % Liberal Democrats Les Allen 1,615 44.2 Labour Simon Peter Parkes 1,188 32.5 Conservative Maxwell Arnold John Bradley Craven 853 23.3 Turnout Liberal Democrats hold
Mackworth Location of Mackworth ward Mackworth (1 seat) Party Candidate Votes % Labour Paul Pegg 1,587 67.0 Conservative Valerie Joan Taylor 377 15.9 Green Katy Cheatham 231 9.8 Liberal Democrats Catrin Sian Rutland 174 7.3 Turnout Labour gain from Liberal Democrats
Mickleover Location of Mickleover ward Mickleover (1 seat) Party Candidate Votes % Liberal Democrats Hilary Jane Jones 1,807 40.3 Conservative Alison Joyce Holmes 1,481 33.0 Labour Lester John Pendrey 910 20.3 Green Jean MacDonald 285 6.4 Turnout Liberal Democrats hold
Normanton Location of Normanton ward Normanton (1 seat) Party Candidate Votes % Labour Hardyal Singh Dhindsa 2,092 61.0 Liberal Democrats Muhammed Afsar 1,035 30.2 Conservative Hardial Singh Dhamrait 8.9 305 Turnout Labour hold
Oakwood Location of Oakwood ward Oakwood (1 seat) Party Candidate Votes % Conservative Frank Harwood 1,348 47.7 Labour Neil Wilson 1,084 38.4 UKIP Lee Allen 276 9.8 Liberal Democrats Roger Anthony Jackson 116 4.1 Turnout Conservative gain from Liberal Democrats
Sinfin Location of Sinfin ward Sinfin (1 seat) Party Candidate Votes % Labour Baggy Shanker 1,880 78.1 Conservative Arron Mathew Marsden 273 11.3 Liberal Democrats Kelly Anne Keenan 254 10.6 Turnout Labour hold
Spondon Location of Spondon ward Spondon (1 seat) Party Candidate Votes % Conservative Evonne Williams 1,587 47.9 Labour Steve Froggatt 1,305 39.4 BNP Vanessa Griffin 270 8.1 Liberal Democrats Simon Kirkman King 153 4.6 Turnout Conservative hold
References ^ "Local Election Results 2012". Andrew Teale . ^ "Local Election Results 2012". Derby City Council .
 6
6  1
1 


 Council elections in Derbyshire


